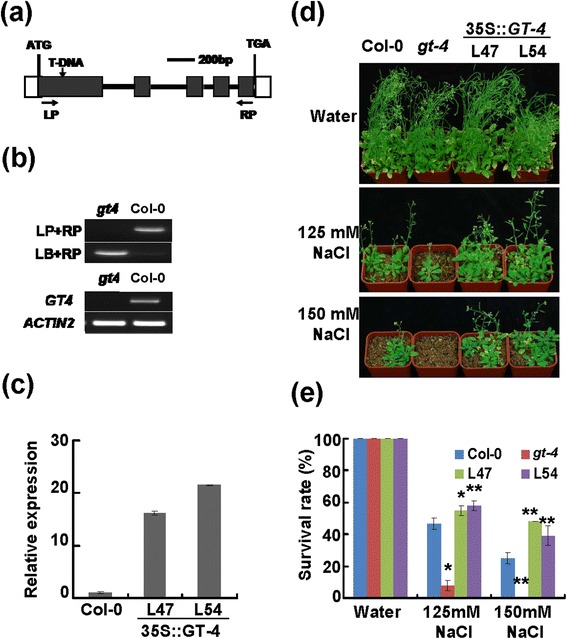
Figure 3.

Identification of gt-4 mutant and GT-4 -overexpressing lines and performance of these plants under salt stress. (a) T-DNA insertion site in GT-4 in the gt-4 mutant. The filled black boxes represent ORFs, while the lines between the boxes represent introns. LP and RP are primers used for PCR analysis. (b) RT-PCR analysis of the GT-4 transcript levels in seedlings of Col-0 and mutant lines. The Actin2 gene was used as an internal control. (c) GT-4 transcripts in Col-0 and GT-4-over-expression plants by qRT-PCR analysis. Bars indicate SD (n = 3). (d) Performance of various plants under salt stress. Seven-day-old plants were transferred to NaCl-containing pot and grew for 5 weeks. (e) Survival rates of plants after salt treatments. Bars indicate SD (n = 4). Each replicate uses 16 plants. Asterisks indicate a significant difference compared to the corresponding Col-0 (*P <0.05 and **P <0.01).
