Figure 6.

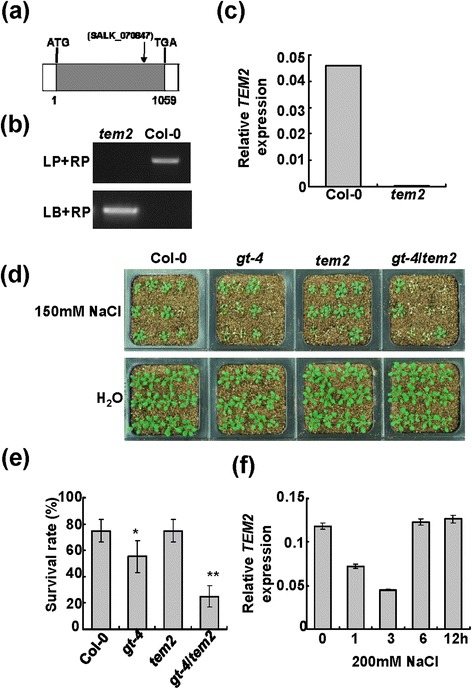
Performance of various single and double mutants in response to salt stress. (a) The T-DNA insertion site in TEM2 gene of the tem2 mutant. The filled grey box represents the ORF. (b) T-DNA insertion confirmation of the tem2 mutant. (c) TEM2 transcripts in Col-0 and mutant plants by qRT-PCR. The Actin2 was used as an internal control. Bars indicate SD (n = 3). (d) Performance of Col-0, gt-4, tem2 and gt-4/tem2 plants under salt stress. 9-day-old seedlings were transferred to soil saturated with water or 150 mM NaCl and grew for 10 days. (e) Survival rates of plants after salt treatments. Bars indicate SD (n = 4). Asterisks indicate a significant difference compared to Col-0 (*P <0.05 and **P <0.01). (f) TEM2 expression levels in response to salt stress. Bars indicate SD (n = 3).
