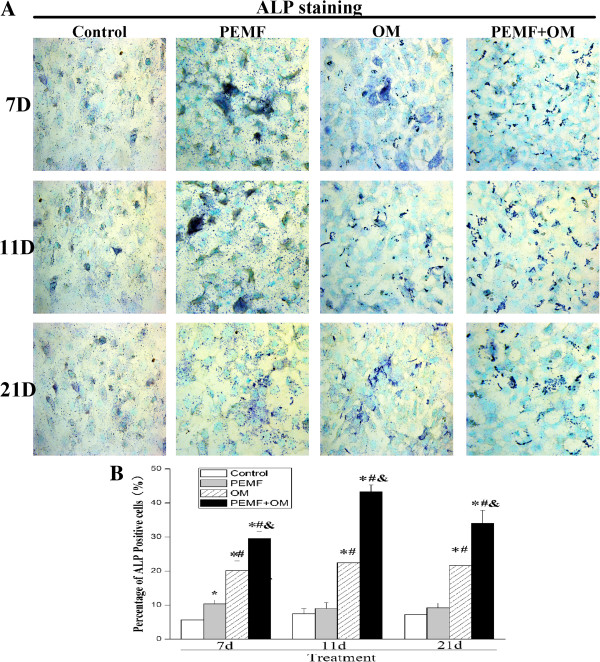
Figure 3.

ALP activity was increased during the osteogenic differentiation of AECs. (A) The ALP activity was detected by BCIP/NBT staining (magnification of 400×). (B) The percent of ALP-positive cells (containing blue, insoluble, granular dye deposit) was calculated by ImageJ software Experiments were performed three times with the similar results (n = 3 in each group). * indicates P < 0.05 vs Control, # indicates P < 0.05 vs PEMF and & indicates P < 0.05 vs OM.
