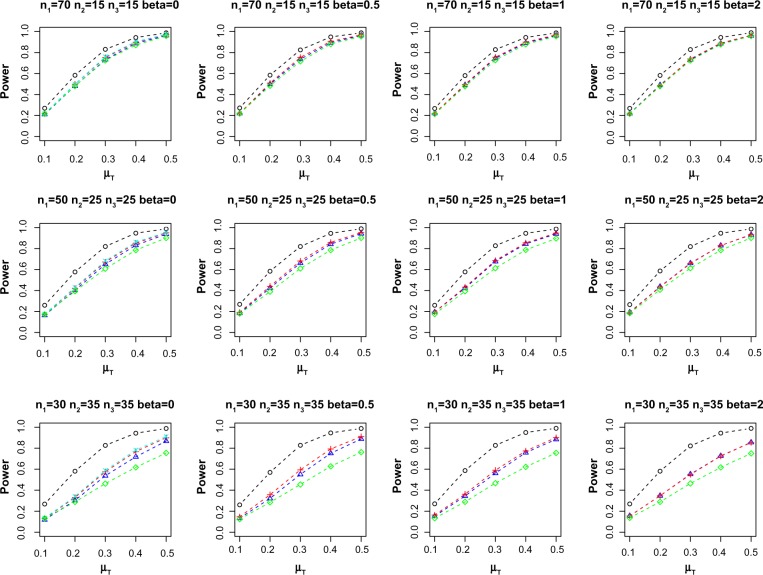
Figure 1.
Average power at nominal α = 0.05. Sample size (n1, n2, n3) and effect of confounding β are indicated in the header of each plot. Power curves for methods that did not control Type I error (ie, empirical Type I error > 0.055) are not shown.
Notes: ○: Gold-std, ∆: FM-PS, +: Reg-PS, ×: two-sample, and ⋄: paired only.

