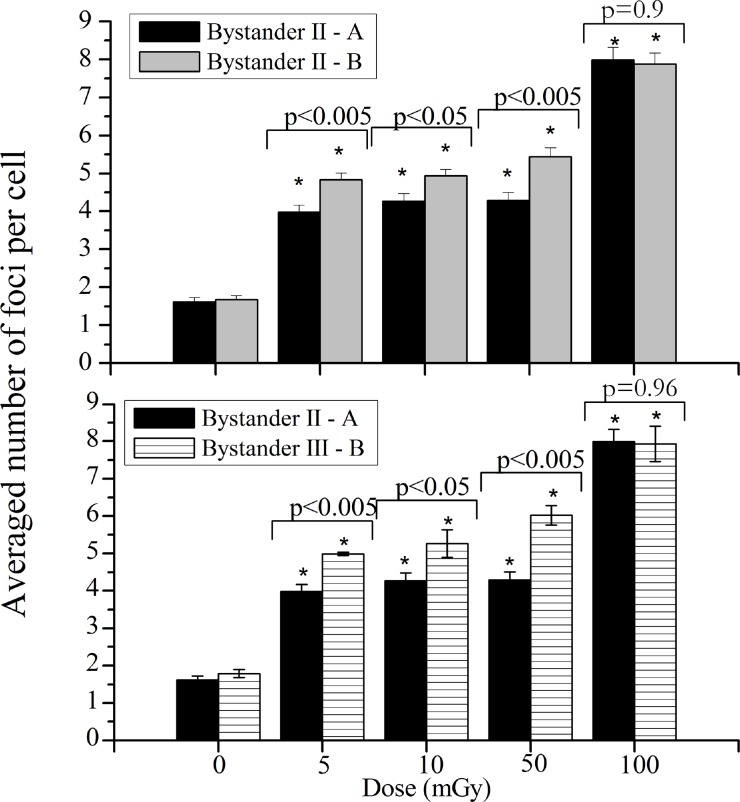
FIGURE 6.
Induction of DSBs in the “bystander II-A” and “bystander II-B” areas (up) and “bystander II – A” and “bystander III – B” areas (down), corresponding to non-irradiated cells in the areas more distant o the irradiated cells, in case of a lower and a higher number of irradiated cells, respectively. Data were collected from three independent experiments. Error bars represents the SEM and *p<0.005.

