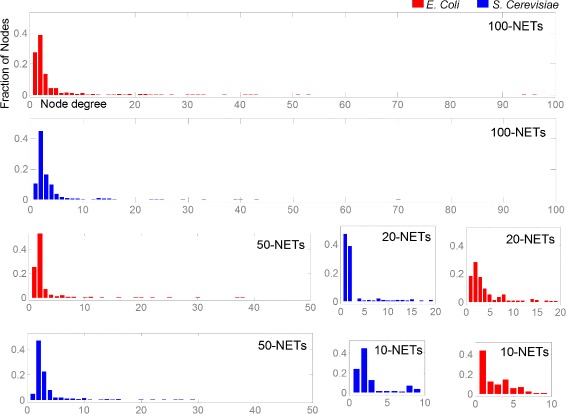
Figure 2.

Degree distribution (in-degree plus out-degree) of nodes in E. coli (red) and S. cerevisiae (blue) for 10-NETs, 20-NETs, 50-NETs and 100-NETs. Each distribution is obtained from the data of all 10 sampled network instances. X-axis has been shifted up for better visibility. The distribution shows the presence of both large and intermediate hubs indicating that the networks are non-trivial.
