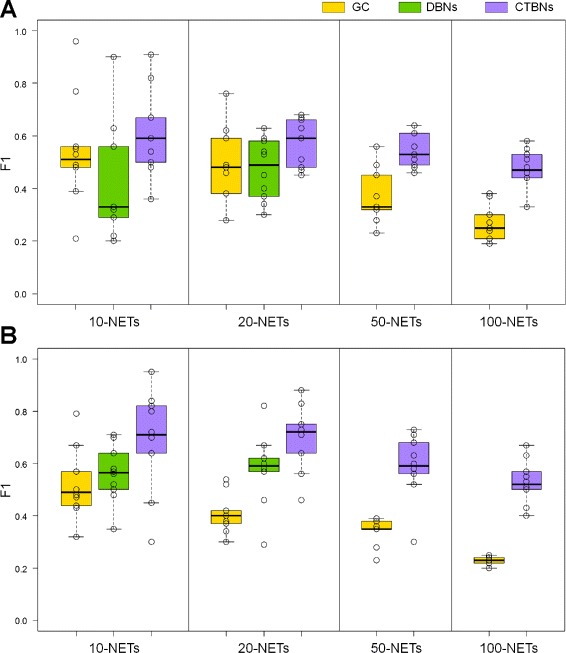
Figure 3.

Performance comparison of CTBNs, DBNs and GC on simulated data for different network sizes. Organism E.coli (A) and S. cerevisiae (B). Boxplots represents the F 1 values obtained on the 10 sampled network instances of each size, which are also plotted individually as circles.
