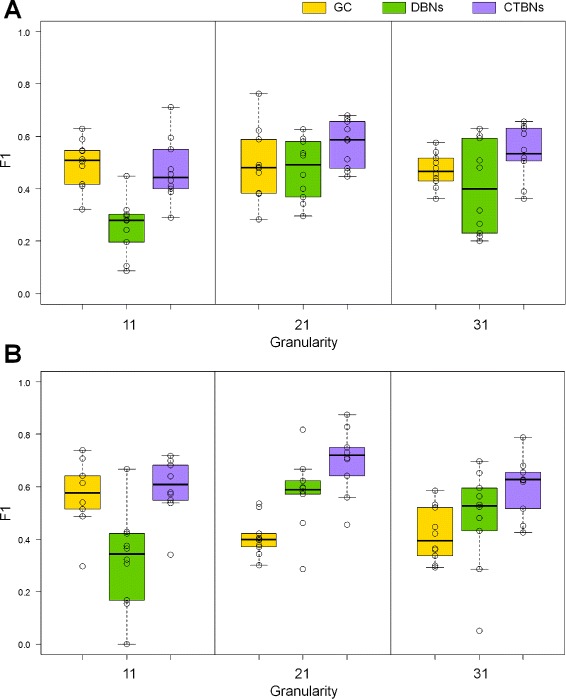
Figure 4.

Performance comparison of CTBNs, DBNs and GC on simulated data for different time granularities on 20-NETs, organism E. coli (A) and S. cerevisiae (B). The set of 20NETs does not change, what changes is the granularity of the time course data generated from the networks. Boxplots represents the F 1 values obtained on the 10 sampled network instances of each size, which are also plotted individually as circles.
