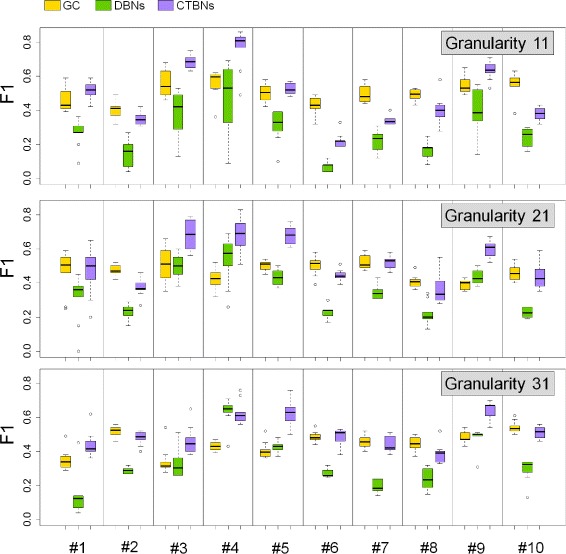
Figure 5.

Performance comparison of CTBNs, DBNs and GC on simulated data for unevenly spaced time points on 20NETs, organism E. coli , for different time course granularities. Each boxplot represents the F 1 values achieved by the method over the set of 10 unevenly sampled time points instances; the sampled time points are consistent among the three methods. Results are shown separately for each of the 10 network instances of the 20NETs set.
