Figure 6.

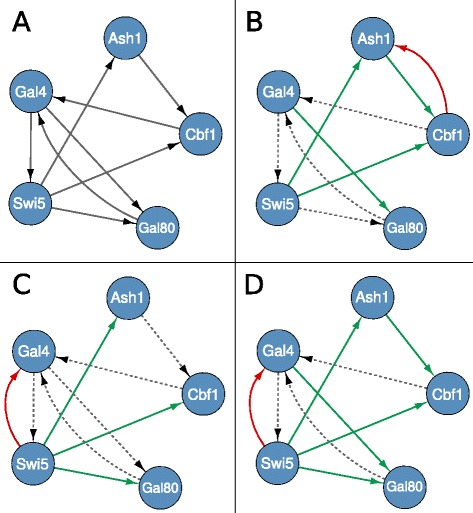
Performance comparison on S. cerevisiae experimental data. True network (A), network inferred by GC (B), DBNs (C), CTBNs (D). Green arcs represent true positives, red arcs false positives and dotted lines false negatives.

Performance comparison on S. cerevisiae experimental data. True network (A), network inferred by GC (B), DBNs (C), CTBNs (D). Green arcs represent true positives, red arcs false positives and dotted lines false negatives.