Figure 1.

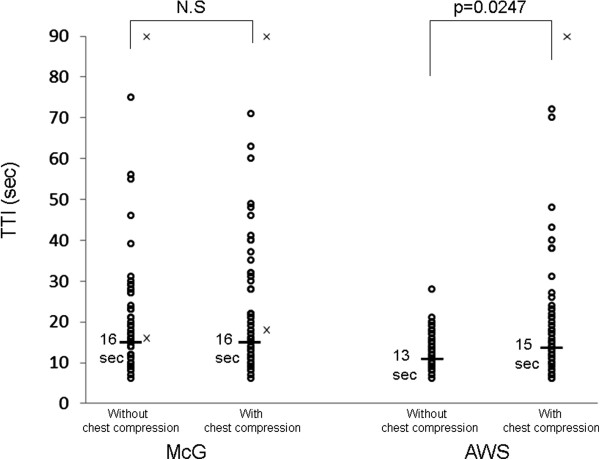
Scatter graph of TTI in all of participants using each device without and with chest compression. The thick bar indicates the median TTI. Open circles indicate successful tracheal intubations, and x indicates a failed tracheal intubation.

Scatter graph of TTI in all of participants using each device without and with chest compression. The thick bar indicates the median TTI. Open circles indicate successful tracheal intubations, and x indicates a failed tracheal intubation.