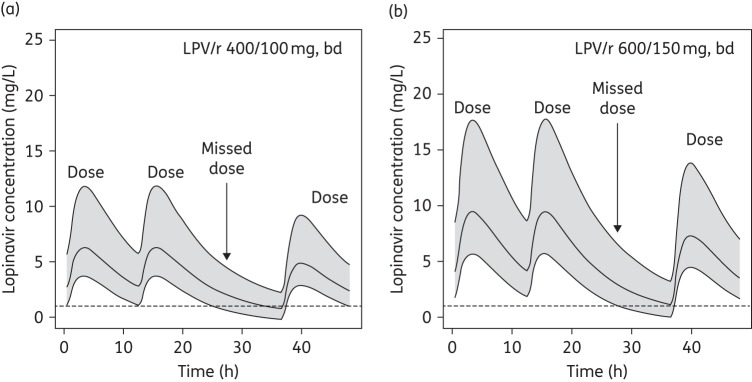
Figure 3.

Simulated lopinavir concentration–time curves following a missed dose with (a) 400/100 mg of lopinavir/ritonavir twice daily and (b) 600/150 mg of lopinavir/ritonavir twice daily. Lines represent the 5%, 50% and 95% percentiles and shaded areas are the 90% CIs. The broken line represents the target lopinavir Ctrough of 1.0 mg/L for treatment-naive patients. LPV/r, lopinavir/ritonavir; bd, twice daily.
