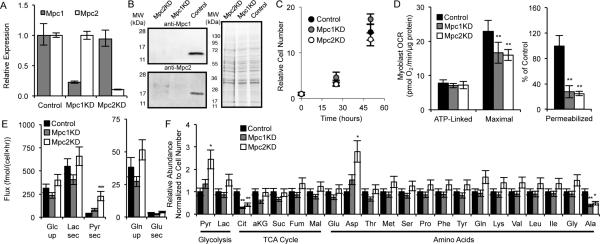
Figure 1. MPC knockdown does not affect the overall metabolic state of cells.
(A, B) Relative expression of Mpc1 and Mpc2 as determined by qPCR (A) and western blot (B). (C-E) Proliferation (C), oxygen consumption rates (OCR; D), and extracellular substrate fluxes (E) of Control, Mpc1KD, and Mpc2KD cells. (D) ATP-linked and maximal respiration of intact cells and pyruvate-dependent respiration in permeabilized cells (measured as outlined in Experimental Procedures). (F) Relative abundance of intracellular metabolites. Error bars represent minimum and maximum relative expression as calculated by qPCR data analysis software (A), standard deviation (SD) (C, E, F), or standard error of the mean (SEM) (D). *, **, and *** indicate p<0.05, p<0.01, and p<0.001 respectively by ANOVA with Dunnett's post-hoc test.

