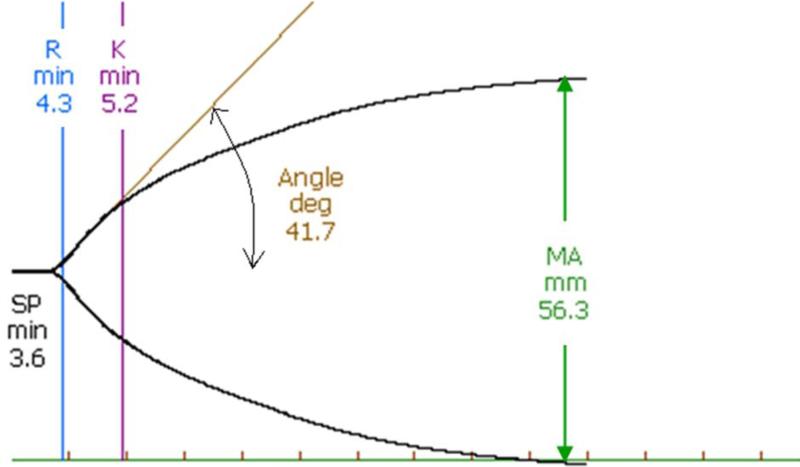
Figure 1. Scheme of parameters obtained by thromboelastography (TEG).
Split Point (SP) is the time from sample placement to first divergence of the trace. Reaction time (R) is the time from sample placement until TEG tracing amplitude reaches 2 mm. Both of SP and R denote the initial fibrin formation rate. K value is the time from the end of R until the TEG tracing amplitude reaches 20 mm. It represents the time for development of fixed degree of viscoelasticity during clot formation. Angle is formed by the slope of the initial TEG tracing, and it reflects the speed at which solid clot forms. Maximum Amplitude (MA) is the greatest amplitude of the TEG tracing, and it reflects platelet function and the maximum strength of the fibrin clot.

