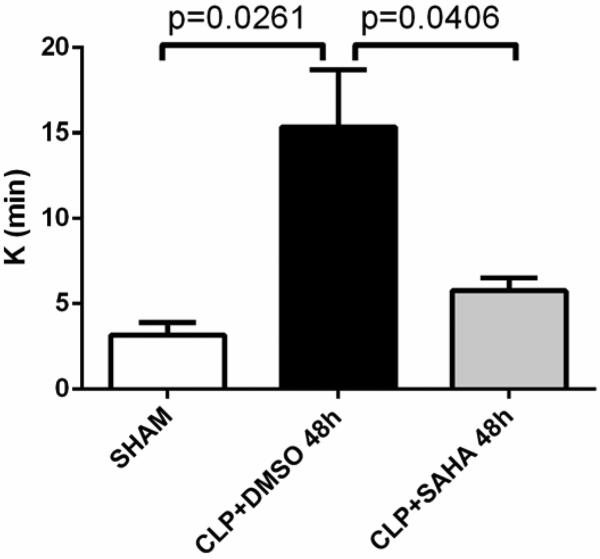
Figure 3. Clot propagation as represented by K.
K value is the time from the end of R until the clot reaches 20 mm, which indicates the time for development of fixed degree of viscoelasticity during clot formation and fibrin cross-linkage. The K values were recorded with the TEG® 5000 Thrombelastograph® Hemostasis Analyzer System and compared between three experimental groups (means ± SEM, n = 5-8 animals/group).

