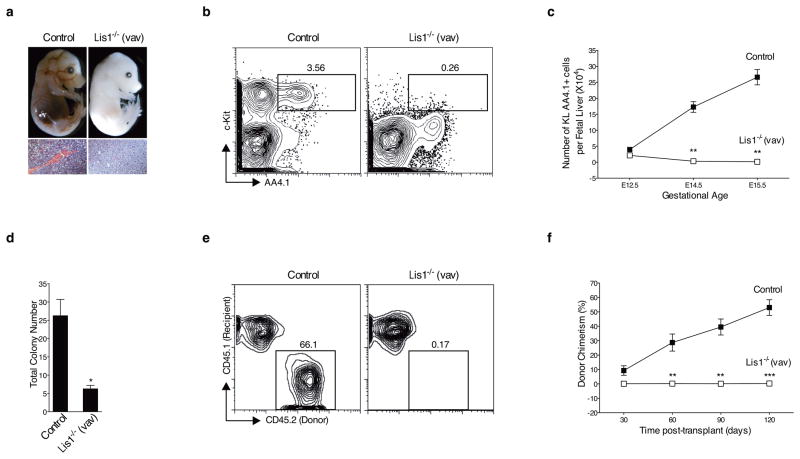
Figure 1. Genetic deletion of Lis1 impairs establishment of the hematopoietic system during embryonic development.
(a) Representative image of Control (Lis1f/+, upper left) and Lis1−/− (Lis1f/f; Vav-Cre, upper right) littermates at E14.5. Hematoxylin and eosin (H&E) stain of fetal liver from Control (bottom left) and Lis1−/− (bottom right) littermates at E14.5. 40X. Scale bars, 55μm. (b) Fetal liver cells from Control (Lis1f/+) and Lis1−/− mice were analyzed for frequency of HSCs (cKit+ Lin− AA4.1+; KL AA4.1+). Dot plots are shown for representative Control (left) and Lis1−/− (right) E14.5 embryos. (c) Absolute number of HSCs (KL AA4.1+) from Control (Lis1f/+ or Lis1f/f; solid squares) or Lis1−/− (open squares) mice at different gestational ages; n=3–5 mice for each genotype for each gestational age; **P=0.0014 for E14.5, **P=0.0018 for E15.5. (d) Number of colonies generated from Control (Lis1f/+ or Lis1f/f) and Lis1−/− fetal liver. Cells are isolated from 3–6 embryos of each genotype; *P=0.0110 (n=3, technical replicates). (e) Representative FACS profile of donor chimerism (4 months) in CD45.1+ recipients transplanted with HSC-enriched cells (Lin− AA4.1+) from either Control (Lis1f/+) or Lis1−/− E14.5 embryos. (f) Average donor chimerism at different times post-transplantation (2–4 donor mice were used for each genotype and 4–6 recipient mice in each cohort). Control: solid squares; Lis1−/−: open squares; **P=0.0088 for 60 days, **P=0.0021 for 90 days and ***P=0.0006 for 120 days. Error bars show standard error of the mean (SEM).

