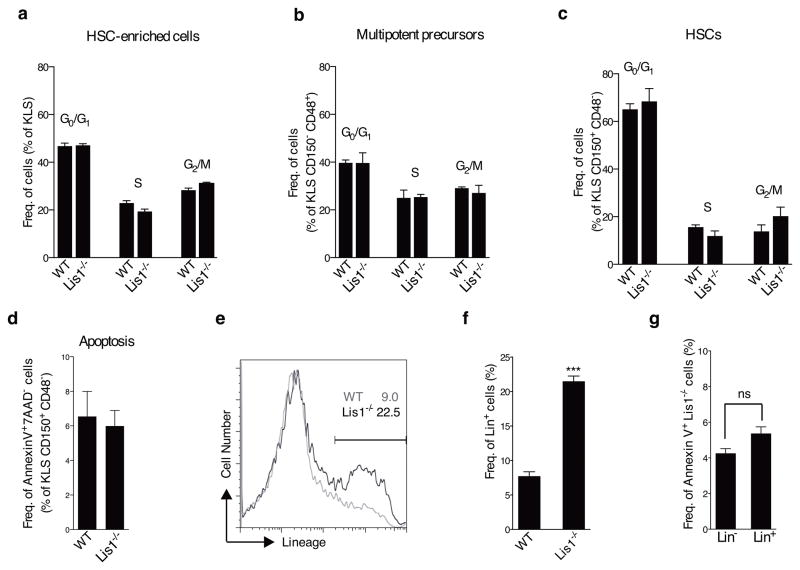
Figure 3. Lis1 deficiency leads to accelerated differentiation of hematopoietic stem cells.
(a–c) Cell cycle status of hematopoietic cells following Lis1 deletion. Control (Lis1+/+; Rosa-creER; WT) and Lis1f/f; Rosa-creER (Lis1−/−) mice were treated with tamoxifen and cell cycle analyzed after BrdU incorporation. Average frequency of KLS (a), KLS CD48+ CD150− (b), and KLS CD150+ CD48− (c) in G0/G1, S, and G2/M cell cycle phases in control (WT) and Lis1−/− mice. Data shown are from two independent experiments (n=2–3 per cohort). (d) Percentage of HSCs (KLS CD150+ CD48−) undergoing apoptosis (AnnexinV+ 7AAD−) in control (WT) and Lis1−/− mice. Data shown are from three independent experiments (n=2–3 per cohort). (e) Analysis of rate of differentiation of Lis1−/− cells. KLS cells from control (Lis1+/+; Rosa-creER; WT) and Lis1f/f; Rosa-creER (Lis1−/−) mice were treated with tamoxifen in vitro. Representative FACS plot shows frequency of cells expressing lineage markers in WT (shown in gray) and Lis1−/− (shown in black) populations 24 hours post-deletion. (f) Average frequency of cells expressing lineage markers (Lin+) in WT and Lis1−/− cells. Data shown are from three independent experiments; ***P=0.0002. (g) Analysis of apoptosis in Lin− and Lin+ fraction of Lis1−/− cells. Percentage of Annexin V+ cells is shown 24 hours post-deletion. Data shown are from two independent experiments. Error bars show the standard error of mean (SEM).

