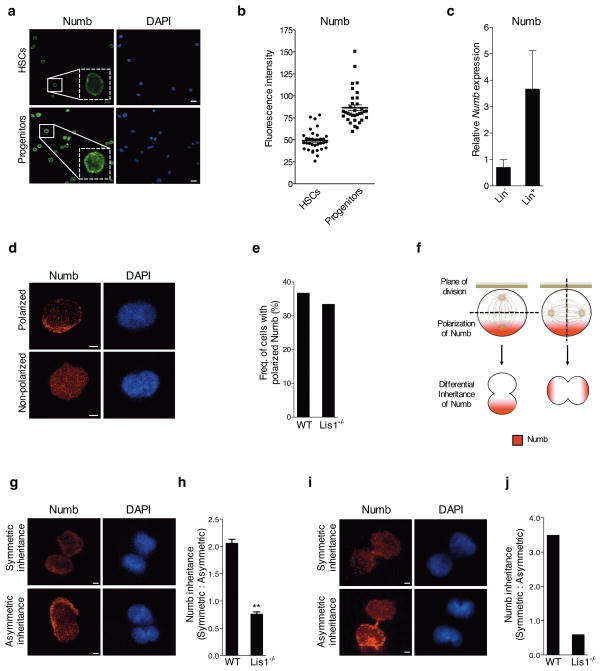
Figure 4. Loss of Lis1 impairs inheritance of fate determinants in hematopoietic development.
(a) Expression of Numb in HSCs and progenitor cells. Representative image with magnified inlay (dotted white box) shows HSCs (KLS CD48− CD150+) and progenitor cells (KLS CD48+) stained with anti-Numb antibody (green) and DAPI (blue), 63X. Scale bars, 10μm. (b) Average fluorescence intensity of Numb in individual HSCs and progenitor cells. Data shown are from two independent experiments (n=34 cells for each genotype); ****P<0.0001. (c) Realtime RT-PCR analysis of Numb expression in Lin− and Lin+ cells (n=2 independent experiments). (d) Representative images of individual HSC-enriched cells with polarized or non-polarized Numb (Numb in red, DAPI in blue, zoomed 63x images, Scale bars, 2.5μm). (e) Frequency of control (WT) or Lis1−/− cells with polarized Numb. Frequencies were determined out of 100 tracked cells for each genotype. (f) Model illustrates how two dividing cells may equivalently polarize Numb (shown in red) to one side of the cell, yet direct the cleavage plane in such a way to ensure either equal or unequal inheritance of Numb into the incipient daughter cells. (g) Representative image of a tracked cell inheriting Numb symmetrically (top) or asymmetrically (bottom) into incipient daughter cells (Numb in red, DAPI in blue, zoomed 63x images, Scale bars, 2.5μm). (h) Relative ratios of symmetric:asymmetric division in vitro. Data shown are from two independent experiments; n=25–27 dividing cells were assessed for each experiment per cohort; **P=0.0032. (i) Representative image of symmetric (top) and asymmetric (bottom) inheritance of Numb by incipient daughter cells in vivo (Numb in red, DAPI in blue, zoomed 63x images, Scale bars, 2.5μm). (j) Relative ratio of symmetric:asymmetric division in vivo (nine dividing cells were assessed for the control (WT) group; eight dividing cells were assessed for the Lis1−/− group. Data analyzed using three independent chimeric mice for each genotype).

