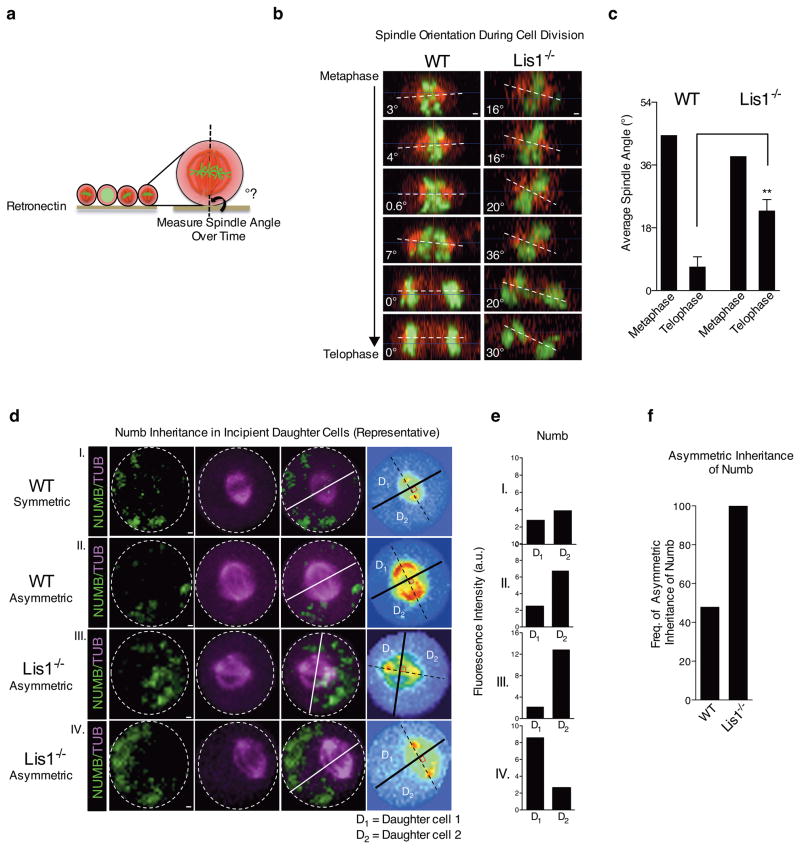
Figure 5. Loss of Lis1 impairs spindle orientation in hematopoietic development.
(a) Schematic showing how spindle angle is measured relative to the retronectin base. (b) Representative side view images of a control (WT) and Lis1−/− cell undergoing cell division and their spindle angles. Scale bars, 1μm. (c) Average metaphase and telophase spindle angles of control (WT) and Lis1−/− cells relative to substrate; data shown are from three independent experiments; n=5–7 cells per genotype; **P=0.0054. (d) Numb distribution in dividing HSC-enriched cells relative to mitotic spindle orientation. Representative images of control (WT) cells (I and II) or Lis1−/− cells (III and IV) with examples of symmetric (I) or asymmetric (II, III, IV) inheritance of Numb by incipient daughter cells. Numb (green), α-tubulin (magenta); representative videos of a cell undergoing symmetric or asymmetric cell division are shown in Supplementary Videos 2–4. Scale bars, 1μm. On far right panel, each cell is displayed in spectrum color format to facilitate accurate identification of spindle position (dotted black line connecting the two centrosomes highlighted in red) and the cleavage furrow (solid lines; white and black) which partitions the dividing cell into incipient daughter 1 (D1) and daughter 2 (D2). (e) Quantification of fluorescence intensity of Numb in D1 and D2 for each representative control (WT; I and II) or Lis1−/− cell (III, IV) shown in (d). (f) Frequency of cells undergoing asymmetric inheritance of Numb in control (WT) or Lis1−/− cells; data are shown for four independent experiments; n=23 cells for WT and n=9 cells for Lis1−/−. All error bars show the standard error of mean (SEM).

