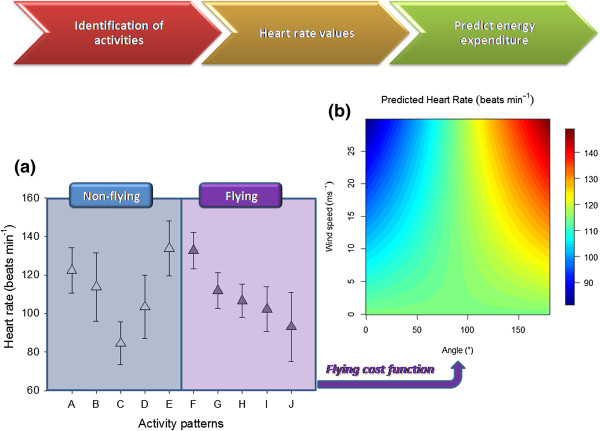
Figure 1.

Workflow of the estimation of heart rate values depending on the activity. (a) Mean (± SD) values of heart rate (beats min-1) for different activities (extracted from Figure 2 in [28]). Non-flying modes were from A to E (A: ‘landing’; B: ’30 min after landing’; C: ‘resting’; D:’30 min before take-off’, E: ‘take-off’; represented by white triangles). Flying modes were from F to J (F,G, H, I and J correspond to ‘flying’10,30,60,120 and 720 min after take-off; represented by dark grey triangles). (b) Flying cost model based on [13, 14]. Estimated values of energy expenditure values while flying are obtained in heart rate units (beats min-1) considering the effect of the angle between flight track and wind direction θ and wind speed w. w ranges from 0 to 30 m s-1, whereas θ ranges from 0° to 180° indicating that birds were flying with tail and head winds, respectively. The cost of flying was intermediate in two situations: in the absence of wind and when birds were flying with cross winds (light blue values).
