Figure 4.

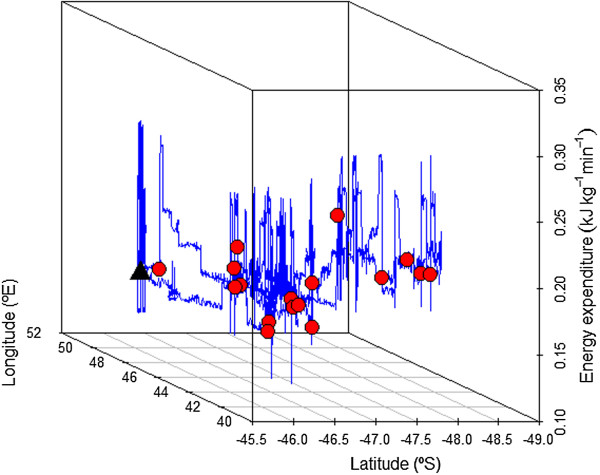
Spatial illustration of the fine-scale energy expenditure (kJ kg -1 min -1 ) of individual 075 (prey capture points in red). The colony is represented by the black triangle.

Spatial illustration of the fine-scale energy expenditure (kJ kg -1 min -1 ) of individual 075 (prey capture points in red). The colony is represented by the black triangle.