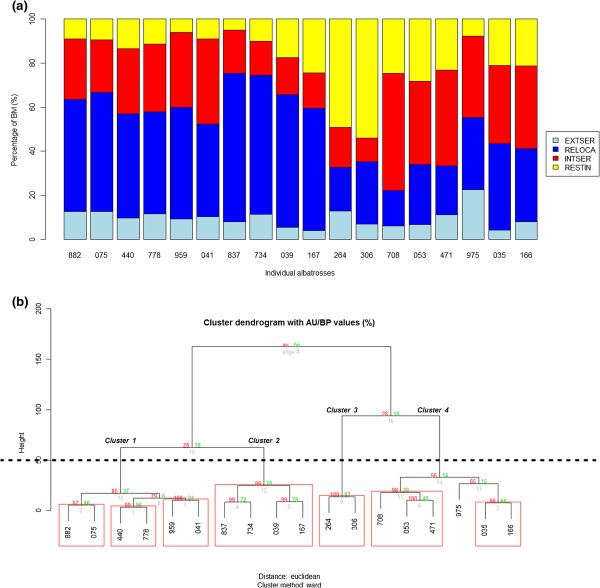
Figure 5.

Identification of foraging strategies based on individual percentages of behavioural modes. (a) Relative duration (%) of each behavioural mode (EXTSER: extensive search; RELOCA: relocation; INTSER: intensive search; RESTIN: resting) within the 18 individual foraging trips. (b) Output of the hierarchical clustering analysis to group individual foraging strategies based on the relative duration (%) of each behavioural mode using the Pvclust package via multiscale bootstrap resampling. Significant clusters with probability P ≥ 0.95 are indicated by red rectangles, as well as the 50% similarity level by the black dotted line.
