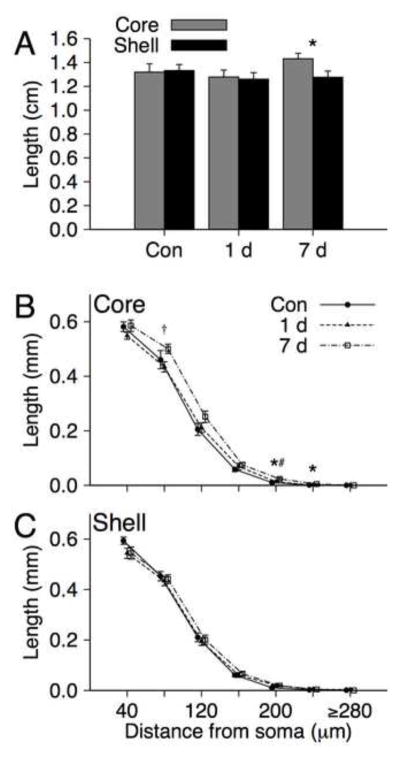
FIGURE 2.
A) Mean (+SEM) dendritic length of medium spiny neurons in the NAc Shell and Core for control (n = 8), 1 day withdrawal (n = 8) and 7 day withdrawal (n = 9) groups. * indicates a significant region effect at p < 0.05. B) Mean (± SEM) dendritic length as a function of distance from soma (in 40μm segments) of medium spiny neurons in the NAc Shell and Core for control, 1 day withdrawal and 7 day withdrawal groups. * indicates a significant group effect at p = 0.02, † indicates a significant contrast (7 day > 1 day withdrawal) at p = 0.019, # indicates a significant contrast (7 day withdrawal > Control) at p = 0.005.

