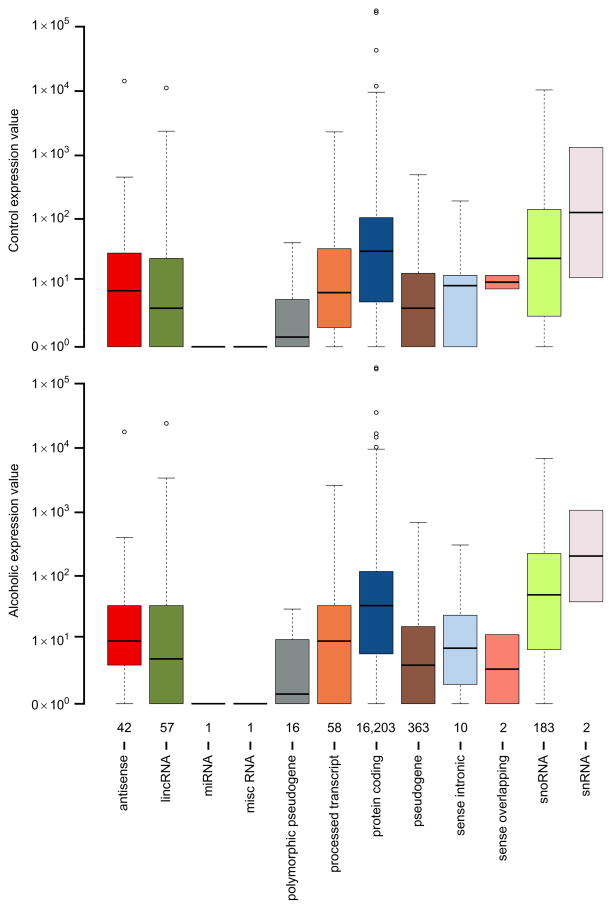
Figure 11.2.
Expression values of the detected biological features for alcoholics and matched controls. Box and whisker plots for expression of biological features in representative controls (A) and alcoholics (B) from the prefrontal cortex. Shown along the x-axis is the number of corresponding biotypes determined for all samples having greater than zero counts. The two groups have similar overall expression values for biological features.

