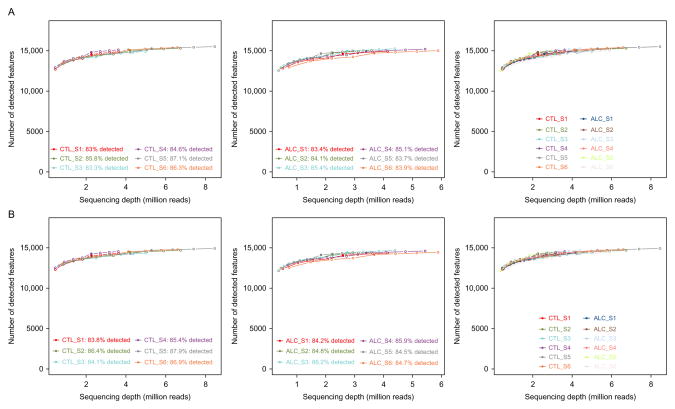
Figure 11.4.
Saturation plots for assessing quality control across individual samples and disease groups. Number of detected features compared with sequencing depth in million mapped reads for controls (left), alcoholics (middle), and all samples (right) for all biological features detected (A) and “protein-coding” transcripts only (B). Figures demonstrate all samples have comparable saturation slopes and can be included in downstream analysis.

