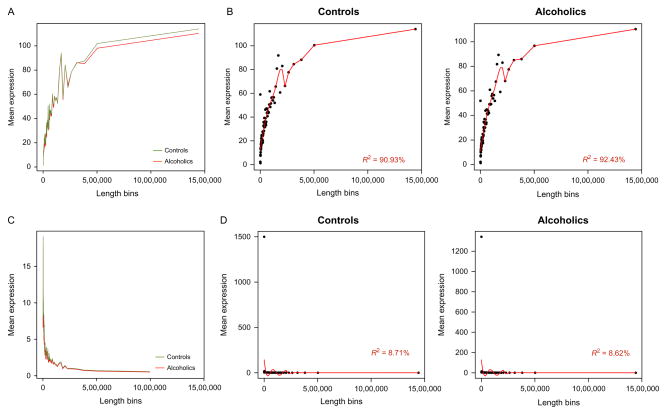
Figure 11.5.
Assessment of gene expression for bias in sequencing length. The size of detected biotypes is binned along the x-axis and compared to mean expression values of raw counts (top) and normalized expression by reads per kilobase per million (RPKM) mapped reads (bottom). Alcoholic and control samples follow similar trends in raw mean expression values (A) and RPKM values (C). Mean raw count values in controls and alcoholics are highly associated with feature length (B); however, feature length is not strongly correlated with mean RPKM (D).

