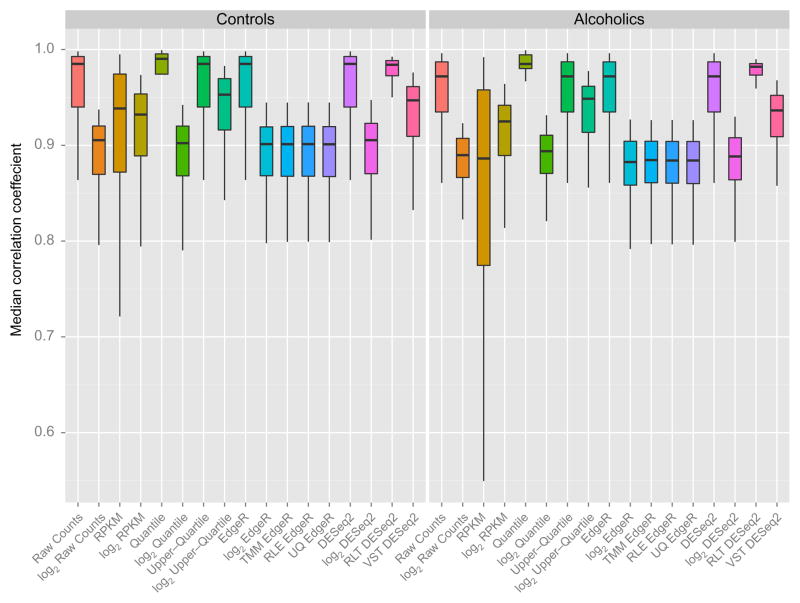
Figure 11.7.
Comparison of normalization strategies for assessing gene expression in controls and alcoholics. Box and whisker plots for intersample Pearson correlation coefficients of control and alcoholic prefrontal cortex gene expression across multiple strategies for normalizing RNA-Seq count data. Differing methods of normalization exhibit differing median intersample consistency and within group variation, which may affect experimental outcomes. The appropriate method should be based on the quality control measures and hypothesis in question.

