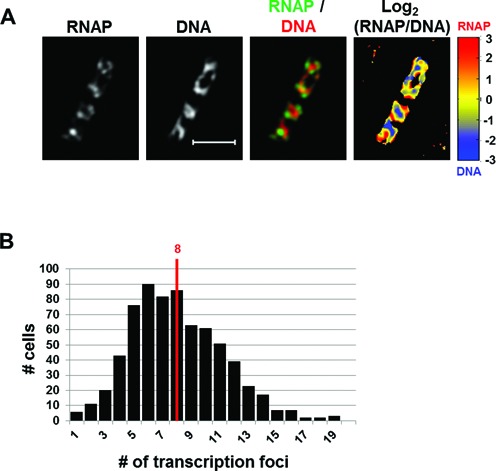
Figure 1.

SIM co-imaging of RNAP and DNA reveals spatial compartmentalization of transcription foci in fast-growing cells. (A) Images of RNAP, DNA (nucleoid), and an overlay of RNAP and DNA from a representative fast-growing E. coli cell (LB, 37°C). On the overlay image, the RNAP is false-colored in green and the nucleoid in red. The scale bar represents 2 μm. The log2 (RNAP/DNA) plot (heat map) is a quantitative representation of the relationship between RNAP and DNA, which is represented by a color scale bar with values ranging from −3 to 3. Note that regions enriched up to 8-fold in RNAP over DNA are at the periphery of the nucleoid (red foci) and regions enriched up to 8-fold in DNA over RNAP in the center of the nucleoid (blue regions). (B) The histogram showing the distribution of apparent RNAP-Venus foci in fast-growing cells. The red line indicates the median number of transcription foci in the population of cells.
