Figure 5.

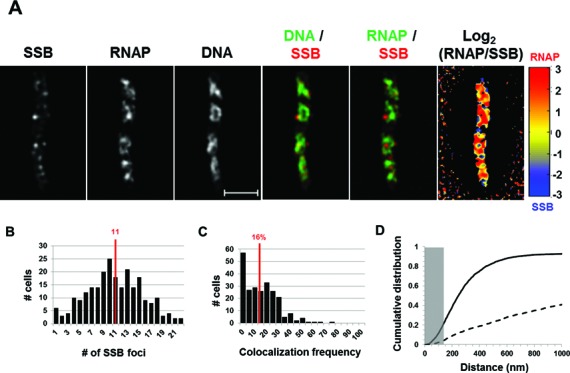
Spatial segregation of transcription foci and replisomes tracked by SSB. (A) Images of SSB, RNAP, DNA (nucleoid), overlays of SSB (red) and DNA (green), RNAP (green) and SSB (red) and log2 (RNAP/SSB) (heat map) from a typical fast-growing E. coli cell as described in the legend to Figure 1. SSB foci tend to separate from transcription foci (red and green colors on the overlay of SSB and RNAP and red and blue color on the heat map). Note also that SSB foci seem largely to be separated from high intensities of DNA signals in the nucleoids (red and green colors on the overlay of SSB and DNA). (B) The distribution of apparent SSB-mCherry foci in fast-growing cells. The red line in the histogram indicates the median number of SSB foci in the population of cells. Note that the median number of SSB foci is close to that of SeqA foci in fast-growing cells. (C) Co-localization frequency between the SSB foci and transcription foci in fast-growing cells. The red line indicates the median co-localization frequency of SSB foci with transcription foci in the population of cells as described in the Materials and Methods section. Most of the SSB foci are segregated from transcription foci in fast-growing cells. The average co-localization frequency of SSB foci and RNAP foci from a random data set is 0%. (D) Cumulative distribution of the distances between SSB foci and their closest RNAP foci in the population of cells as described in the Materials and Methods section. (──) SSB-mCherry RNAP-Venus and (- - -) SSB-mCherry RNAP-Venus random. The gray rectangle represents the co-localization area (≤140 nm). Only 22.3% of the SSB foci are within 140 nm of the closest RNAP foci.
