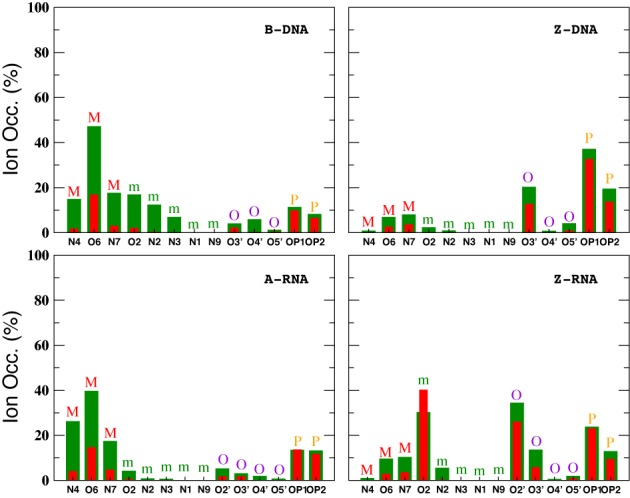
Figure 13.

Ion occupancies with respect to specific atoms at 0.4-M salt concentration within the direct binding region. Colors represent ion type: Na+ (red) and K+ (green). The results represent average values with respect to the entire duplex. Letters on top of the bars represent different nucleic acid regions: M (major groove), m (minor groove), O (O′ oxygen atoms on backbone) and P (phosphate oxygens).
