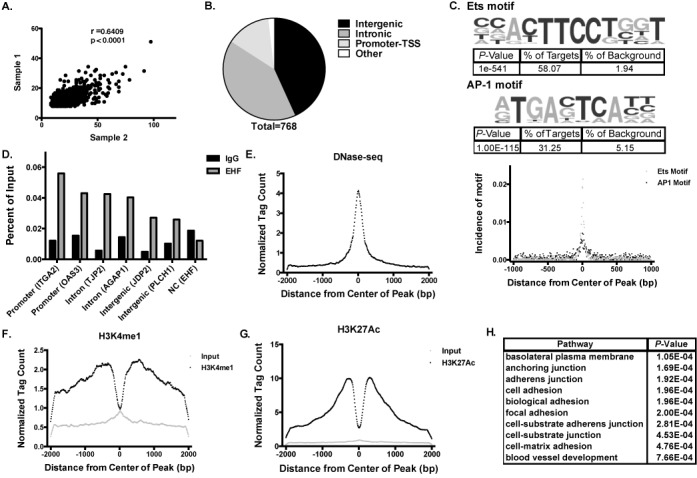
Figure 1.

ChIP-seq in airway epithelial cells identifies genome-wide binding sites of EHF. (A) Comparison of tag counts between peaks identified in two biological replicates of EHF ChIP-seq experiments. (B) Number of EHF peaks found at intergenic sites, in introns, promoters and other sites (including exons, 5'UTRs and 3'UTRs). A total of 768 peaks were identified. Most peaks were found in either intergenic or intronic regions. (C) (Top) De novo motif analysis shows that EHF ChIP-seq peaks are enriched for an Ets motif similar to the consensus sequence for epithelial-specific Ets transcription factor subfamily proteins (58.07% of peaks within a 50 bp window, 82.29% within a 200 bp window) and the AP-1 binding motif (31.25% of peaks within a 200 bp window). (Bottom) Incidence of motifs measured as distance from the center of EHF ChIP-seq peaks in base pairs (bp). (D) ChIP-qPCR validated EHF binding to 6 peaks identified by ChIP-seq (n = 2). Peaks are labeled based on their location with the nearest gene in parentheses. An intergenic negative control site showed no enrichment. (E) Calu-3 DNase-seq tag counts measured from the center of EHF peaks. (F) As (E) for H3K4me1 ChIP-seq. (G) As (E) for H3K27ac ChIP-seq. (H) Gene ontology analysis by DAVID on the nearest genes to each EHF peak.
