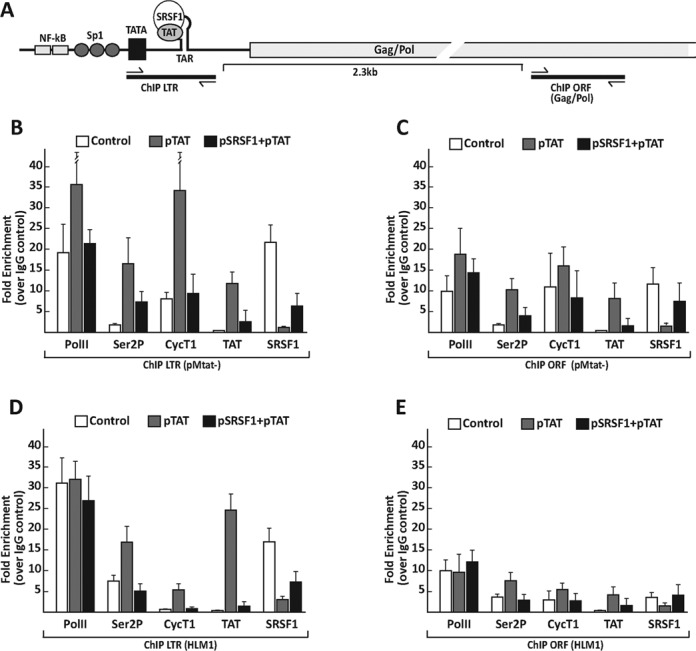
Figure 5.

ChIP analysis of transcription and splicing factors at the HIV-1 promoter of transiently transfected and integrated proviruses. (A) The schematic diagram shows the HIV-1 promoter and downstream sequences, indicating the location of the primer sets used for ChIP of the TAR and ORF. (B and C) HEK293 cells were transfected with the viral clone pMtat(–), a control plasmid, the Tat expression vector alone or in combination with SRSF1. (D and E) HLM1 cells were transfected with a control plasmid, the Tat expression vector alone or in combination with SRSF1. ChIP assays were performed 48 h after transfection, with antibodies for the indicated proteins and the GFP-tagged Tat. Values represent the relative enrichment in ChIP signal to the TAR (B and D) and ORF (C and E) relative to the control IgG, and are the average of three independent PCRs from two independent ChIP experiments.
