
Figure 5.
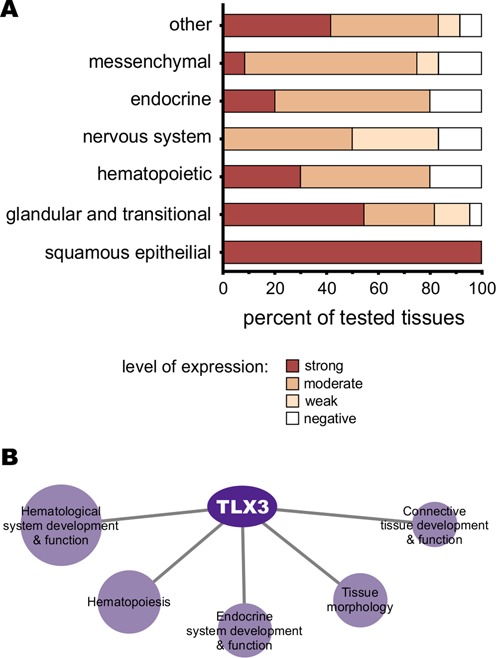
Predicted function of the TLX3 TF. (A) Protein expression levels of TLX3 as reported in the Human Protein Atlas (60). The tissue types were broadly grouped and the percent of observed expression levels were calculated for the tested subtissues within each category. Detailed expression levels in subtissues are presented in Supplementary Table S9. (B) Ingenuity pathway analysis of observed targets genes of TLX3 obtained with the TF2DNA predicted binding motif. The figure shows the five most significantly enriched networks in the physiological system development and function category. Sphere sizes are proportional (logarithmic scale) to the amount of genes populating the category. The TLX3 target genes that were enriched within this category are listed in Supplementary Table S12.