
Figure 3.
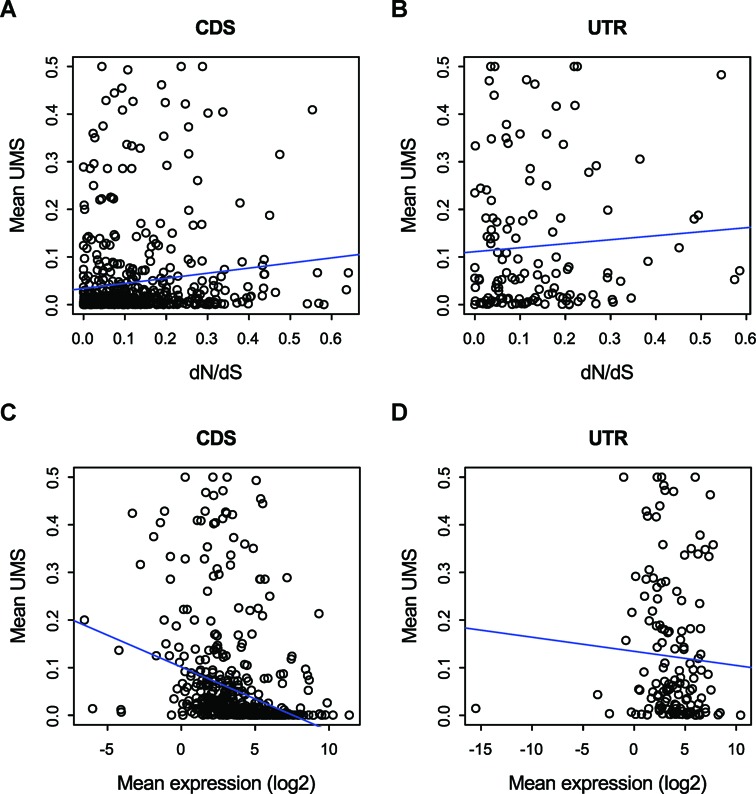
The UMS of AS GYNNGYs in CDS is positively correlated with the ratio of non-synonymous (dN) and synonymous (dS) substitution rates and negatively correlated with gene expression levels (panels A and C, Spearman's rho = 0.18, P = 1.95 x 10⁻⁵ and rho = −0.51, P < 2.2 x 10⁻¹⁶, respectively). The same trends are shown for UTR, too, but only significant for the case of gene expression (panels B and D, rho = 0.09, P = 0.31 and rho = −0.17, P = 0.0393, respectively).