. 2014 Oct 7;42(22):e166. doi: 10.1093/nar/gku917
© The Author(s) 2014. Published by Oxford University Press on behalf of Nucleic Acids Research.
This is an Open Access article distributed under the terms of the Creative Commons Attribution License (http://creativecommons.org/licenses/by-nc/4.0/), which permits non-commercial re-use, distribution, and reproduction in any medium, provided the original work is properly cited. For commercial re-use, please contact journals.permissions@oup.com
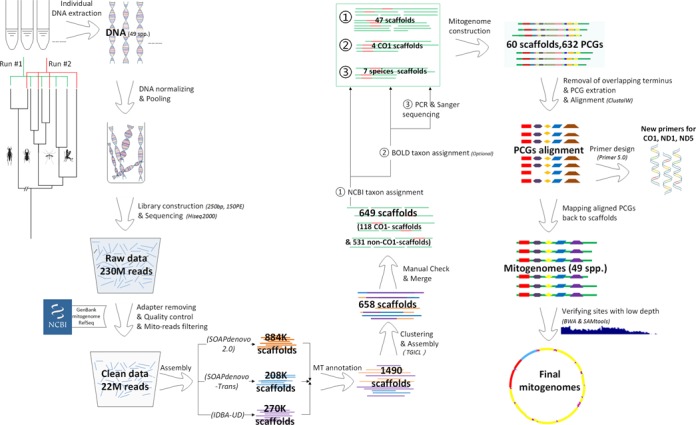
Figure 1.

Schematic illustration of the pipeline.
