
Figure 1.
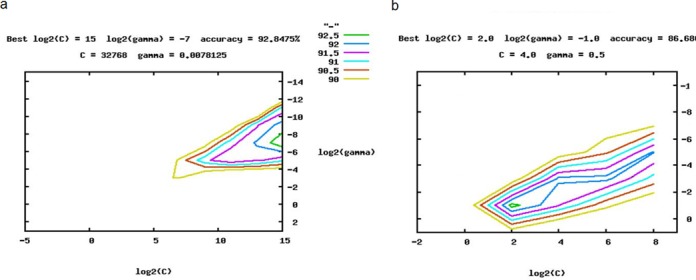
C and γ determination and 5-fold cross validation using LibSVM. The figure shows graphs for different values of the parameters C (a trade-off for misclassification) and γ (inverse width of RBF kernel) on a logarithmic X and Y axis. The ranges of the axes describe the different values that were tested, searching the optimal C and γ values in the grid space. The different colors in the diagram display the different accuracies obtained while optimizing C and γ values. We chose the C and γ values according to the green graphs, respectively, representing the C and γ value with the highest accuracy. (a) C and γ determination and 5-fold cross validation of the two-class SVM. The green graph represents the optimal values for C and gamma. In this case, the highest 5-fold cross validation accuracy (92.89%) is achieved when C = 32768 and γ = 0.008. (b) C and γ determination and 5-fold cross validation of the multi-class SVM. The green graph represents the optimal values for C and gamma. In this case, the highest 5-fold cross validation accuracy (86.69%) is achieved when C = 4 and γ = 0.5.