
Figure 4.
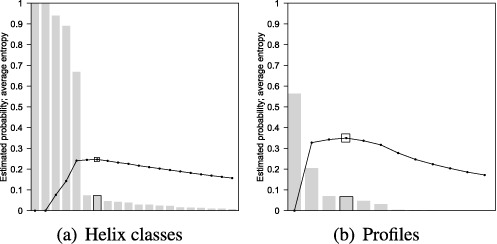
VcQrr3 histograms of estimated probabilities for (a) helix classes and (b) profiles in descending order with graphs of average entropy according to Equation 1 below and its profile equivalent. In (a), the 194 helices observed in the representative sample of 1000 structures were consolidated into 88 helix classes. Only the first 20 are pictured; the estimated probability of the 20th one is 0.8%. In (b), all 13 profiles are pictured but the last seven have frequency <5. The maximum average entropies at the seventh helix class and fourth profile are marked.