
Figure 5.
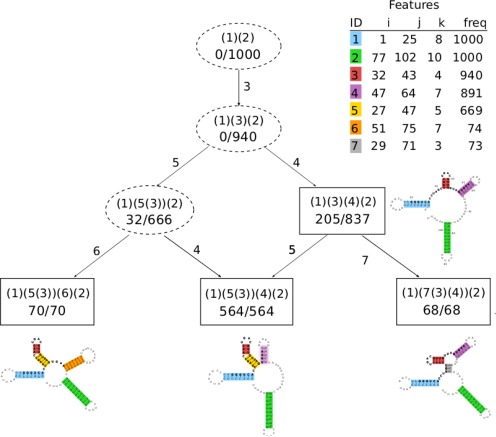
VcQrr3 summary profile graph. Boxes indicate selected profiles, and dashed ovals the intersection ones. Each node is labeled with the profile, in parenthetic notation, along with its specific and general frequencies, written as a ratio. An edge from q to q′ is labeled with the feature(s) from q′∖q. Similarities between profiles are given by the greatest lower bound, aka ‘last common ancestor,’ with differences read from edge labels. The root is always the (possibly empty) profile common to all sampled structures. Features are listed by maximal helix with frequency. For illustrative purposes, the secondary structures from Figures 1 and 3, with features highlighted in color, are shown with their selected profile.