
Figure 6.
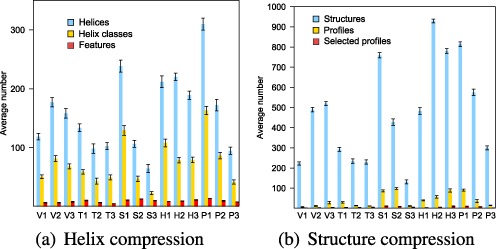
Sample compression via profiling at the (a) helix and (b) combination-of-helices/structure levels. Average number of substructures, respectively helices, helix classes, and features in (a) and structures, profiles, and selected profiles in (b), in 25 samples of 1000 structures for each test sequence. Error bars indicate standard deviations. For additional clarity, a log scale presentation is provided in Supplementary Figure S1.