
Figure 7.
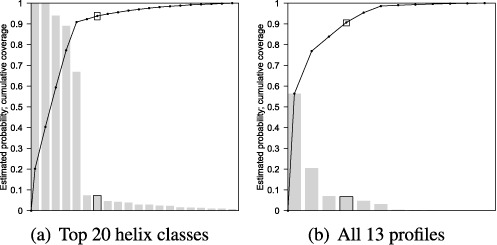
Frequency histograms for VcQrr3 case study with superimposed cumulative distribution functions for (a) the top 20 helix classes and (b) all 13 profiles. Coverage is computed by counting the number of helices (respectively structures) with multiplicity included in the feature set (respectively selected profiles). The features cover 93.8% of observed helices (with multiplicity), and structure coverage for the selected profiles is 90.7%. Results for all test sequences are in Supplementary Table S3.