
Figure 9.
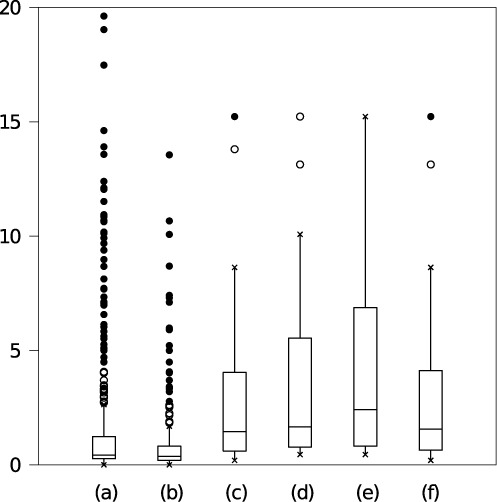
Box plots showing range of standard deviations in frequencies across 25 VcQrr3 Boltzmann samples. Columns correspond to (a) base pairs, (b) helix classes and profiles conditioned on feature sets (c) {c1 − c6}, (d) {c1 − c7}, (e) {c1 − c6, c8} and (f) {c1 − c8}. (Features are indexed in Table 1.) Box midline indicates the median (second quartile). Top and bottom edges mark the first (Q1) and third (Q3) quartile, with inter-quartile range R. Whiskers indicate the furthest point within 1.5R of Q1 and Q3. Open circles are within 3R; closed circles are beyond.