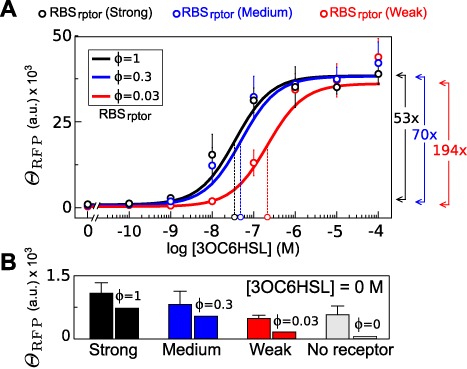
Figure 5.

Transfer function (A) and basal expression (B) obtained from fitting our mathematical model including leakiness with real data. It explains the effect of receptor in amplitude signal and ligand affinity. Arrows show the times of variation from the ratio of Gm/G0 from fitted model equation. Model was manually fitted to data using the following parameter values: γkm0[PT] = 85 M, K2r′ = 5, K3r′ = 500, εR = 10, εL = 10 and  M. Pearson test was applied to the different constructs giving the following correlation coefficients: 0.996, 0.987 and 0.987 for weak, medium and strong, respectively. Comparison of model and real data leakiness in the panel (B) gave a correlation coefficient of 0.984.
