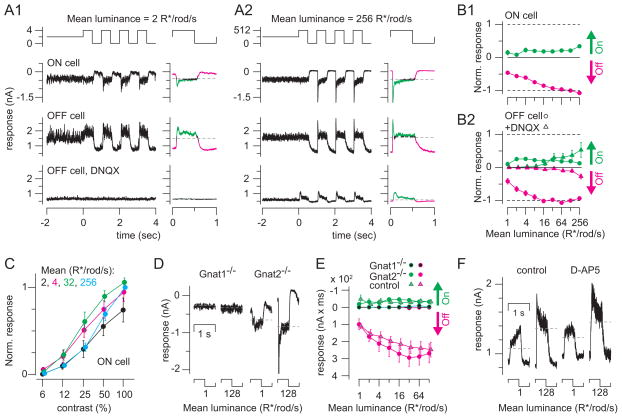
Figure 3. Ganglion cell responses to Michelson contrast depend on the rod → rod bipolar cell pathway.
(A1) Responses to contrast modulation (100% contrast, 1 Hz) at a background of 2 R*/rod/s. Responses are shown for an ON GC and for an OFF GC in control conditions and in the presence of DNQX (100 μM). At right: averaged responses (average of 9 cycles, excluding the first). On responses (green) and Off responses (magenta) are points >1 SD of the baseline current (measured over 2 sec before contrast onset). Vhold = −70 mV (ON cells) or 0 mV (OFF cells; 10 kHz sampling; 2 or 4 kHz Bessell filtering). (A2) Same format and cells shown in A1 at a higher mean background. Averages of 4 cycles (excluding the first) are shown to the right of raw data. (B1) Averaged On and Off integrated responses from ON cells, normalized to the Off response at the 128 R*/rod/s background and multiplied by −1 to generate the same sign as for OFF cells in B2. Data include 7 cells recorded at 1–128 R*/rod/s (1-mm diameter spot) and 5 cells recorded at 2–256 R*/rod/s (0.3-mm diameter spot). Error bars: ±SEM across cells. (B2) Same format as B1 for OFF cells. Data for both control and DNQX conditions were normalized to the control response at the 128 R*/rod/s mean. Control data include 11 cells recorded at 1–128 R*/rod/s (1-mm diameter spot) and 5 cells recorded at 2–256 R*/rod/s (0.3-mm diameter spot). DNQX data include 5 cells recorded at levels 1–128 R*/rod/s (1-mm diameter spot) and 4 cells recorded at 2–256 R*/rod/s (0.3-mm diameter spot). (C) Responses to a number of contrast levels were observed across the range of backgrounds studied. A peak-to-peak response was calculated, from amplitudes measured as in B1, and normalized to the 100%-contrast response at the 256 R*/rod/s mean, before averaging across cells (n = 5; 0.3-mm diameter spot). Error bars: ±SEM across cells. (D) Average responses to one cycle of contrast modulation at means of either 1 or 128 R*/rod/s for ON cells in either Gnat1−/− or Gnat2−/− mice. (E) On and Off integrated responses (nA x ms) for ON cells in Gnat1−/− (n = 5) and Gnat2−/− mice (n = 5) and control cells (n = 7) recorded with the same stimulus (1-mm diameter). Integrated inward currents (On responses) are plotted upward and outward currents (Off responses) are plotted downward to match the conventions in part B. (F) OFF cell’s inhibitory currents recorded at two mean potentials under control conditions and in the presence of D-AP5 (100 μM).

