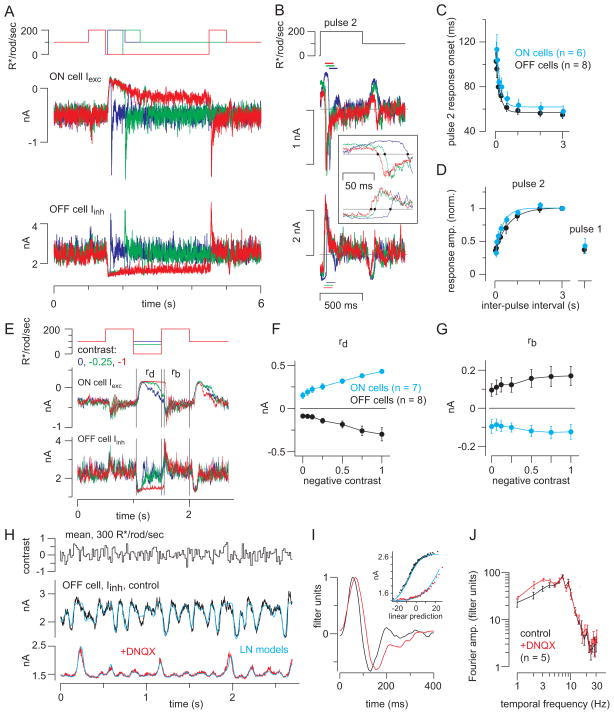
Figure 5. Periods of darkness facilitate synaptic transmisison during subsequent responses to light.
(A) Ganglion cell responses to two light pulses (500 ms) separated by variable periods of darkness (30 ms – 3 s). The example illustrates intervals of 60, 500, and 3000 ms (blue, green and red). Vhold = −70 mV (ON cells) or 0 mV (OFF cells; 10 kHz sampling; 4 kHz Bessell filtering). (B) Responses to the second pulse were background subtracted and aligned to pulse onset. Inset: systematic change in response onset as a function of inter-pulse interval; dots show the time when the response crossed the baseline (gray line). Colors indicate inter-pulse interval, as shown in (A). Response amplitude was quantified over a 100-ms window, starting at the time when the response crossed the baseline (dashed lines). (C) Response onset (see inset in B) became faster with longer inter-pulse intervals. Error bars: ±SEM across cells. Data from ON cells were shifted rightward slightly (30 ms) for visualization purposes (similar shift in part D). Fitted exponential functions are shown for ON (τ = 180 ms) and OFF cells (τ = 175 ms). (D) The pulse 2 response increased with inter-pulse interval. Responses were normalized to the response following the 3-s inter-pulse interval. Pulse 2 responses (leak-subtracted) were measured over a 100-ms window following the determined onset time (see B., inset). The pulse 1 response was measured over a 100-ms window starting 40-ms after pulse onset. Fitted exponential functions are shown for ON (τ = 336 ms) and OFF cells (τ = 606 ms). (E) Different negative contrasts were interspersed between two bright pulses. Background-subtracted responses were measured within windows indicated for the response to dark pulse (rd) and the second bright pulse (rb). (F) The response to dark (outward current in ON cells, inward current in OFF cells) increased with contrast level. Error bars: ±SEM across cells. (G) The response to the second light pulse was nearly the same following different negative contrasts. (H) Response to repeated white-noise stimulation (average of 10 repeats) in OFF ganglion cell inhibitory currents, before and after adding DNQX to block the RB-AII synapse. Cyan lines show the fits from linear-nonlinear (LN) models. (I) LN models in control (black) and DNQX (red) conditions. Adding DNQX caused a slight delay in the filter (normalized to a peak of one) and a reduction in the range of the nonlinearity (Inset). (J) Fourier amplitude of the normalized filters in control and DNQX conditions across cells (n = 5 OFF cells). Band-pass filtering is similar in the two conditions. Error bars: ±SEM across cells. Frequencies plotted are 1–10 Hz and even frequencies between 10 and 20 Hz; data in the DNQX condition were shifted rightward slightly for visualization purposes.

