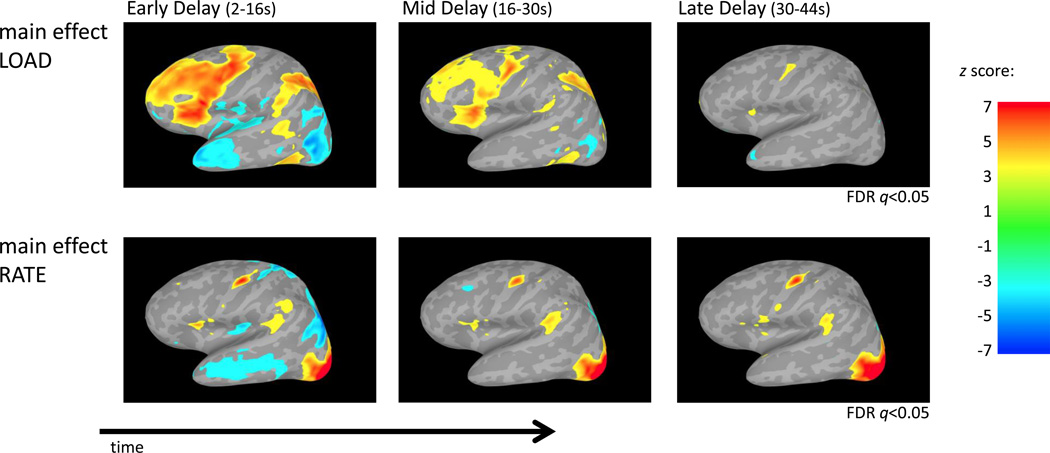
Figure 5. fMRI ANOVA results across time.
Activity estimates (t-values) for each condition for the early, mid and late delay period time phases were separately entered into a two-way parametric repeated measures ANOVA (LOAD, RATE). Results show that the main effect of memory LOAD declined through time. Subsequent analysis reveals this is the result of activity in the high memory load remaining constant, while activity in the low memory loads increases over time (Figure 9). In contrast, the main effect of RATE was primarily restricted to IFG, PM and area Spt (and occipital lobe) and were constant through the delay period without diminishing. No region demonstrated a LOAD×RATE interaction during any part of the delay period. Data from left hemisphere; data shown are z-scores thresholded at FDR q<0.05 for the three time periods in load and rate separately in order to compare changes across time.

