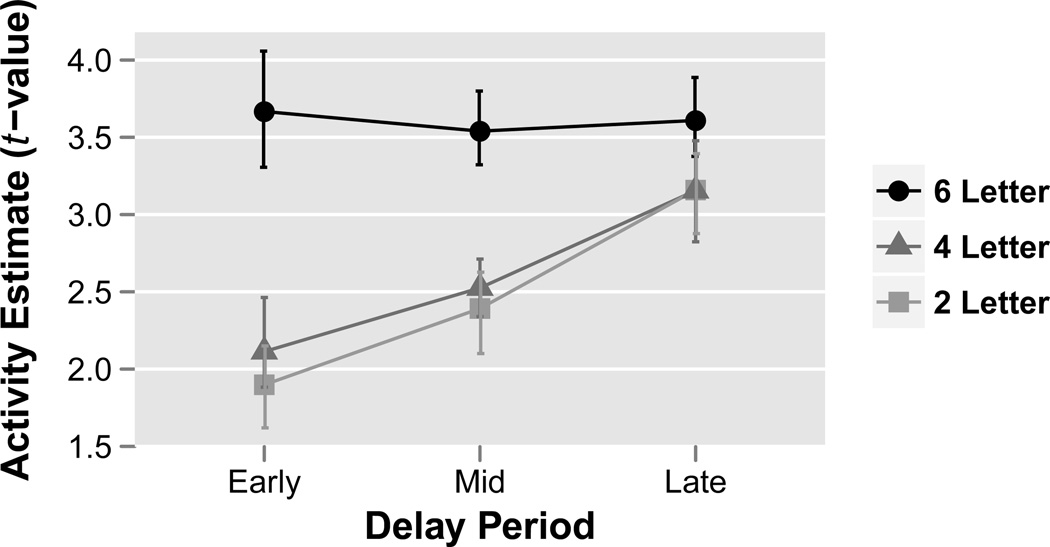
Figure 9. Average activity across all ROIs through time.
Activity estimates (t-values) from Fig. 8 were averaged over rehearsal rate and ROI to investigate the PHASE×LOAD interaction across early, mid and late delay period time phases. Results reveal the dissipating load effects are due to activity in 6-letter condition remaining constant through the delay period while activity in the 2 and 4-letter conditions increase through time. Data plotted are group means. Error bars represent bootstrapped within-subject 95% confidence intervals.

