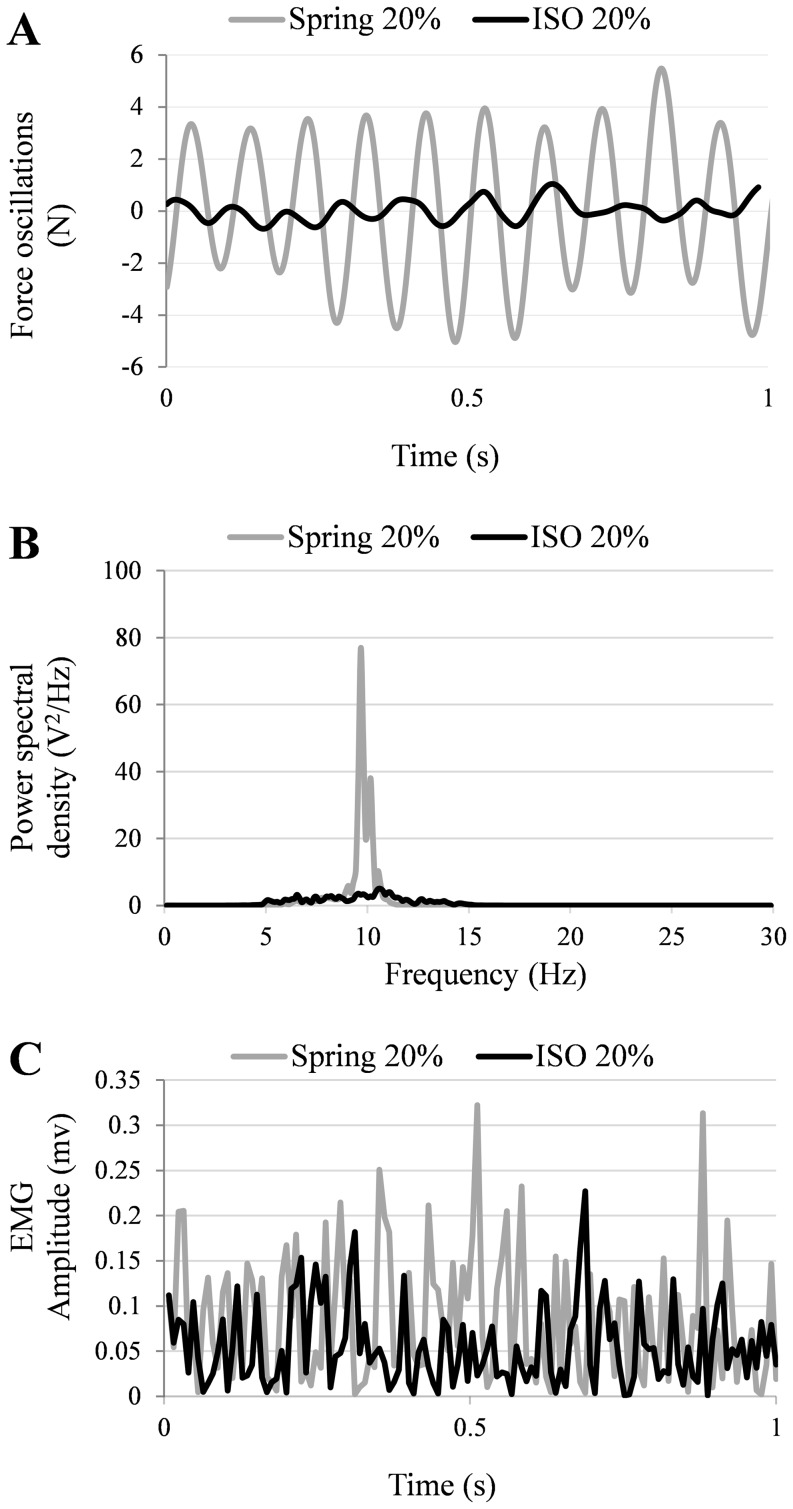
Figure 2. Comparison of force oscillation (A), force power spectral density (B) and EMG amplitude (C) between isometric (black lines) vs. spring (grey lines) contractions in a representative volunteer.
For plot A, mean force values were subtracted from the force signals and force data were low pass filtered (20 Hz).

