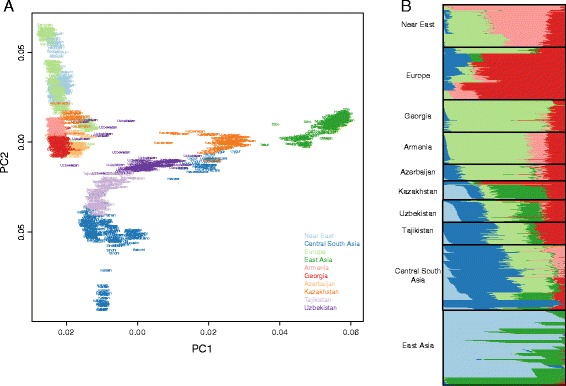
Figure 1.

Population genetic structure. A. Principal component analysis of populations from the Silk Road newly genotyped in this study (SR) with Near Eastern, European, Central-South and East Asian populations. The color scheme reflect geographical regions, the first and second axes explain the 26% and 8.7% of the variance, respectively. SR’s populations form two distinct blocks. B. Model based admixture analysis in the hypothesis of seven clusters. SR’s populations have in general similar amount of European ancestry and there are two opposite gradients in Western and Eastern SR for components shared with Near East and Central-South/East Asia. Both in A and B a number of individuals from Uzbekistan and Kazakhstan are closer to Europe and WSR.
