
Figure 4.
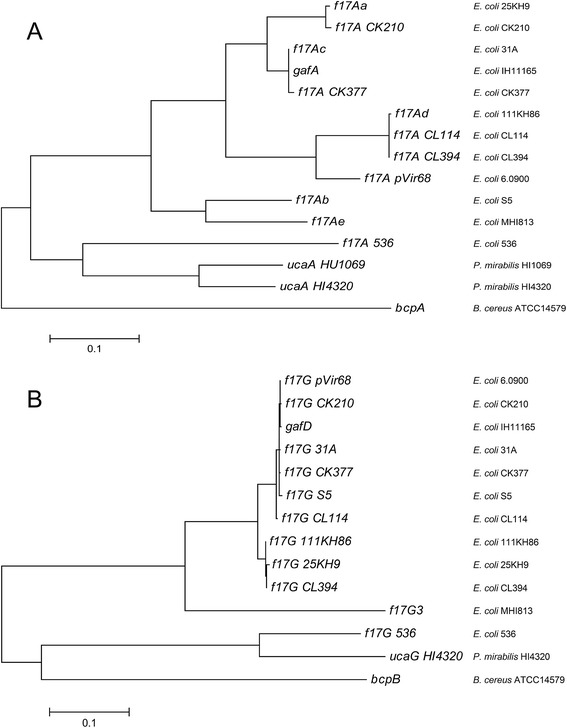
Phenograms of F17-A variants and F17-A-related genetic sequences (A) and F17-G variants and F17-G-related genetic sequences (B). The phenograms were drawn using the Maximum Likelihood method based on the Tamura-Nei model [32]. The trees with the highest log likelihood (−3962.3380 for F17-A, and −4843.1422 for F17-G) were shown. The trees are drawn to scale, with branch lengths measured in the number of substitutions per site.