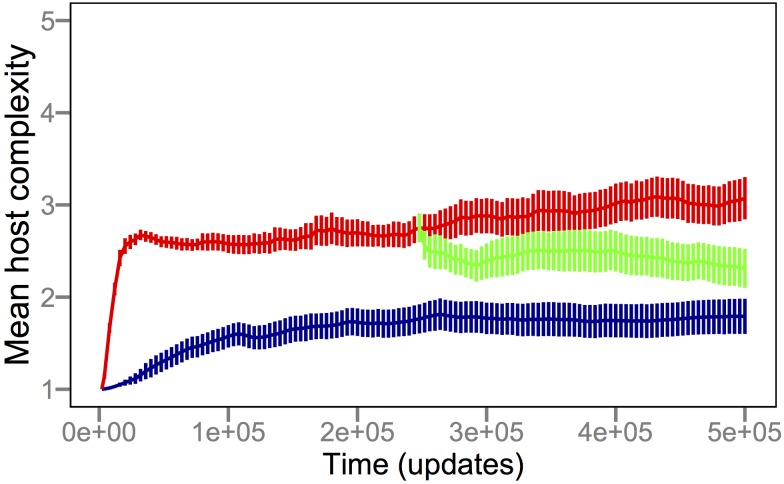
Figure 2. Parasites promote the evolution of host complexity.
Complexity was measured as the minimum number of NAND instructions that must be executed by a host to perform its most complex logic function, averaged over all individuals in a population. The blue trajectory shows the grand mean complexity across 50 replicate populations (i.e., runs) that evolved in the absence of parasites. The red trajectory shows the corresponding values for 50 host populations that coevolved with parasites. In 12 runs, the parasites went extinct, in all but one case after 22,000 updates and after the hosts had evolved either the XOR (complexity 4) or EQU (complexity 5) function. The green trajectory shows mean values for the same 50 parasite populations, except here they were “cured” by experimentally eliminating the parasites after 250,000 updates. All populations started with a single host genotype that performs only the NOT function. Updates are arbitrary Avida time units (see Materials and Methods). Error bars are ±2 standard errors of the mean (SEM).

